I've noticed that there is a difference in the shape and magnitude of my MAP curve when using the "Return to Stock" calibration compared to any other (including the "Stock Equivalent").
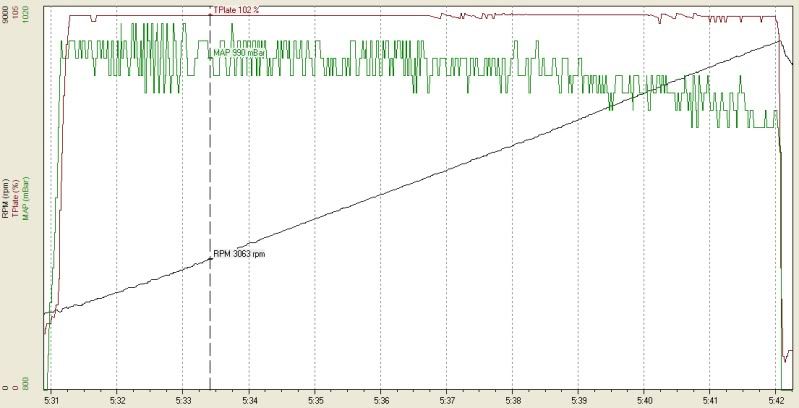
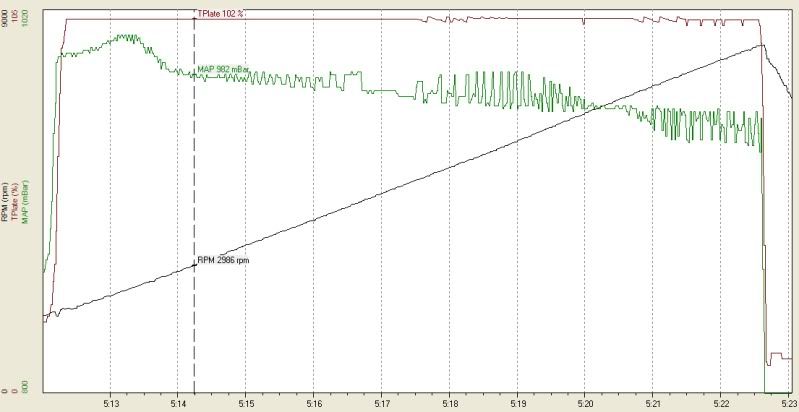
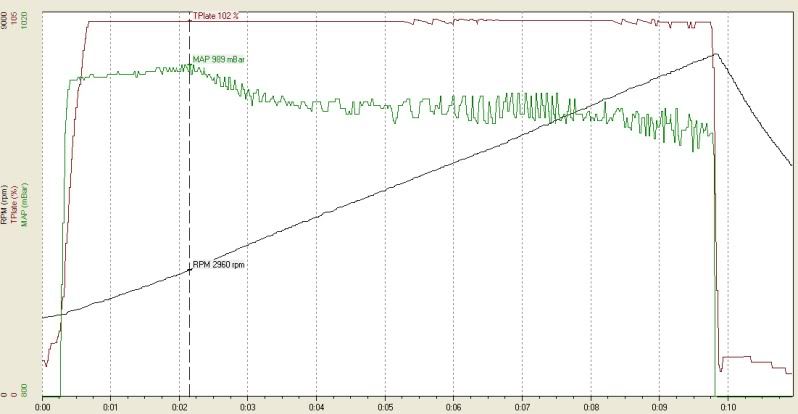
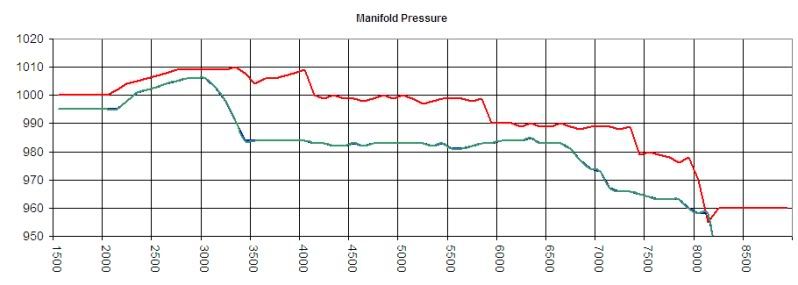
Here are 2 screen shots from a 3rd gear pull in WOT from 2K RPMs to redline. They were both done within 20 minutes of each other. The top is from the RTS calibration and the bottom is from the Toda calibration. Is there a reason why the MAP values are higher for the RTS calibration, and decline in a more linear manner as RPMs rise? Why does the Toda calibration have a finer resolution, and why does it have the "humps"? Could it be some difference in the behavior of TPlate as the RPMs rise? For example, my '06 Lexus would restrict the throttle plate slightly as the RPMs went through the midrange, then would open back up in the high RPMs.
Bug related to MAP or DBW?
- Attachments
-
- RTS Sample.fpdl
- (1.09 MiB) Downloaded 216 times
-
- Toda Sample.fpdl
- (1.04 MiB) Downloaded 210 times
'06 NFR S2000
Here is the same from a more recent datalog using a modified version of the "Stock Equivalent" calibration. The only modification was for my larger fuel injectors.
- Attachments
-
- Stock Eq Sample.fpdl
- (1 MiB) Downloaded 196 times
'06 NFR S2000
Thanks for the quick response. That explains the difference in resolution, but would that also be the reason for the difference in the shape of the curves? Here are the MAP curves from the 1st post (20 minutes apart) overlaid on the same plot with some filtering / averaging. It looks like the RTS calibration is providing better flow between 3500-6000 RPMs, then also above 7000 RPMs.
RTS is red and Toda is green
'06 NFR S2000